| |
Distribution
of Parklands in Sonoma County
Data from
June 16, 2000 Draft Sonoma County Outdoor Recreation Plan
Compiled by the
Coalition for the Outdoor Recreation Plan (CORP)
Among CORP's criticisms of the May 1999
draft ORP was its failure to show a by-district breakdown
of current and proposed parklands, and to show how each
district fared against acres/population standards. (See
also CORP's parkland analysis of
the 1999 draft ORP.)
The June 2000 draft corrected this
deficiency with data by each of six park
planning areas. Unlike the more familiar (five)
supervisorial districts, park planning areas vary greatly
by population as well as size. They are as follows:
Park planning area 1, Sonoma
Coast (part of Supervisorial District 5)
Park planning area 2, North
County (most of Supervisorial District 4);
incluses all of Cloverdale, Healdsburg, and
Windsor
Park planning area 3, Sebastopol
and Russian River (most of Supervisorial District
5)
Park planning area 4, Santa Rosa
(most of Supervisorial District 3 plus bits of 4,
5, and 1)
Park planning area 5, South
County (most of Supervisorial District 2 plus
bits of 3 and 5); includes all of Petaluma,
Cotati, and Rohnert Park
Park planning area 6, Sonoma
Valley (most of Supervisorial District 1)
The acreage/population goals used in the
2000 draft ORP are as follows:
Community and Neighborhood parks:
5 acres/1000 population (these are not considered
further in this analysis)
Regional Recreation Areas (Active):
5 acres/1000 population
Regional Open Space Parks (Passive):
15 acres/1000 population
Federal and State parks: no
acreage/population goal given
The following chart shows how parklands
of all jurisdictions (Federal, State, Councy) are
currently distributed in Sonoma County:
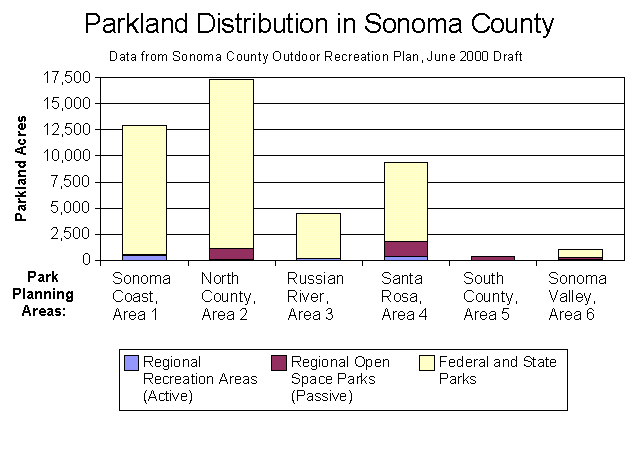
Supporting tabular data appears below on
this page.
A significant change in the 2000 draft of
the ORP was to propose enough parkland in each planning
area to meet the acreage/population goal for that
planning area. (The earlier draft only met the goal
countywide which, CORP argued, only served to exacerbate
the regional inequities shown above.)
This shift has highlighted the very large
acreage deficits in the populous and underserved southern
region, as shown below. Note that this chart only
addresses county parkland deficits, since no acreage/population
standard is set for Federal and State parklands.
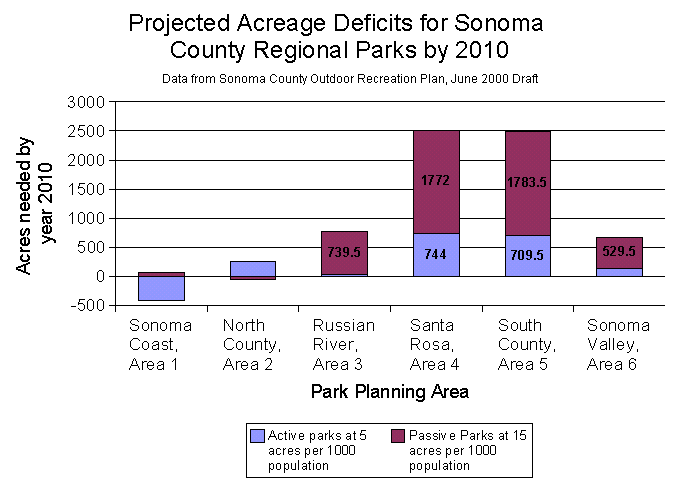
This analysis shows a deficit of around
2500 acres in the Petaluma/Cotati/Rohnert Park and a
similar deficit in the Santa Rosa area.

Here is the complete data by park
planning area, consolidated from Chapter V and Appendix 1
of the June 2000 draft ORP:
Regional
Recreation Areas (Active)
| Park Planning Area |
Population,
Yr. 2010
|
Current
Acres
|
Current
acres/1000 population
|
Acreage
goal at 5 acres/1000 population
|
Estimated
Need, Yr. 2010
|
| Sonoma Coast, Area
1 |
9,900 |
463 |
47 |
50 |
-414 |
| North County, Area
2 |
67,100 |
81 |
1 |
336 |
255 |
| Russian River,
Area 3 |
49,300 |
217 |
4 |
247 |
30 |
| Santa Rosa, Area 4 |
214,800 |
330 |
2 |
1,074 |
744 |
| South County, Area
5 |
141,900 |
0 |
0 |
710 |
710 |
| Sonoma Valley,
Area 6 |
46,700 |
90 |
2 |
234 |
144 |
| County Total |
529,700 |
1,181 |
2 |
2,649 |
1,468 |
Regional
Open Space Parks (Passive)
| Park Planning Area |
Population,
Yr. 2010
|
Current
Acres
|
Current
acres/1000 population
|
Acreage
goal at 15 acres/1000 population
|
Estimated
Need, Yr. 2010
|
| Sonoma Coast, Area
1 |
9,900 |
86 |
9 |
149 |
63 |
| North County, Area
2 |
67,100 |
1,053 |
16 |
1,007 |
-47 |
| Russian River,
Area 3 |
49,300 |
0 |
0 |
740 |
740 |
| Santa Rosa, Area 4 |
214,800 |
1,450 |
7 |
3,222 |
1,772 |
| South County, Area
5 |
141,900 |
345 |
2 |
2,129 |
1,784 |
| Sonoma Valley,
Area 6 |
46,700 |
171 |
4 |
701 |
530 |
| County Total |
529,700 |
3,105 |
6 |
7,946 |
4,843 |
Combined
Regional Parks (Active and Passive)
| Park
Planning Area |
Population, Yr. 2010
|
Current Acres
|
Current acres/1000 population
|
Acreage goal at 20 acres/1000
population
|
Estimated Need, Yr. 2010
|
| Sonoma
Coast, Area 1 |
9,900 |
549 |
55 |
198 |
(-351) |
| North
County, Area 2 |
67,100 |
1,134 |
17 |
1,342 |
208 |
| Russian
River, Area 3 |
49,300 |
217 |
4 |
986 |
769 |
| Santa
Rosa, Area 4 |
214,800 |
1,780 |
8 |
4,296 |
2,516 |
| South
County, Area 5 |
141,900 |
345 |
2 |
2,838 |
2,493 |
| Sonoma
Valley, Area 6 |
46,700 |
261 |
6 |
934 |
673 |
| County
Total |
529,700 |
4,286 |
2 |
10,594 |
6,308 |
Federal
and State Parks
| Park Planning Area |
Population,
Yr. 2010
|
Current
Acres
|
Current
acres/1000 population
|
Acreage
goal
|
Estimated Need, Yr. 2010
|
| Sonoma Coast, Area
1 |
9,900 |
12,410 |
1,254 |
n/a |
n/a |
| North County, Area
2 |
67,100 |
16,203 |
241 |
n/a |
n/a |
| Russian River,
Area 3 |
49,300 |
4,236 |
86 |
n/a |
n/a |
| Santa Rosa, Area 4 |
214,800 |
7,572 |
35 |
n/a |
n/a |
| South County, Area
5 |
141,900 |
41 |
0 |
n/a |
n/a |
| Sonoma Valley,
Area 6 |
46,700 |
802 |
17 |
n/a |
n/a |
| County Total |
529,700 |
41,264 |
78 |
n/a |
n/a |
Combined parks, all
jurisdictions
| Park
Planning Area |
Population, Yr. 2010
|
Current Acres
|
Current acres/1000 population
|
Acreage goal
|
Estimated Need, Yr. 2010
|
Current
standalone Trails (miles)
|
| Sonoma
Coast, Area 1 |
9,900 |
12,959 |
1,309 |
n/a |
n/a |
7 |
| North
County, Area 2 |
67,100 |
17,337 |
258 |
n/a |
n/a |
0 |
| Russian
River, Area 3 |
49,300 |
4,453 |
90 |
n/a |
n/a |
7 |
| Santa
Rosa, Area 4 |
214,800 |
9,352 |
44 |
n/a |
n/a |
3 |
| South
County, Area 5 |
141,900 |
386 |
3 |
n/a |
n/a |
0 |
| Sonoma
Valley, Area 6 |
46,700 |
1,063 |
23 |
n/a |
n/a |
0 |
| County
Total |
529,700 |
45,550 |
86 |
n/a |
n/a |
17 |
|