| |
| |
1% Local Sales Tax |
.25% Open Space District Tax |
| Tax Jurisdiction |
Collections |
Distributions |
Collections |
Net OSD
Contributions |
| Cloverdale |
$2,136,328 |
$2,062,519 |
$526,700 |
$501,460 |
| Healdsburg |
$14,102,476 |
$13,613,255 |
$3,476,887 |
$3,309,787 |
| Petaluma |
$47,625,136 |
$45,971,508 |
$11,741,712 |
$11,177,040 |
| Rohnert Park |
$32,317,694 |
$31,192,071 |
$7,967,748 |
$7,583,720 |
| Sebastopol |
$8,451,742 |
$8,158,724 |
$2,083,730 |
$1,983,628 |
| Sonoma |
$11,145,453 |
$10,758,769 |
$2,747,849 |
$2,615,777 |
| Cotati |
$5,718,556 |
$5,523,045 |
$1,409,878 |
$1,342,816 |
| Windsor |
$6,668,454 |
$6,572,432 |
$1,664,070 |
$1,597,954 |
| Santa Rosa |
$156,906,600 |
$147,748,975 |
$38,684,449 |
$35,922,167 |
| Sonoma County* |
$57,494,881 |
$63,879,644 |
$14,175,043 |
$15,531,040 |
| TOTAL |
$342,567,320 |
$335,480,942 |
$84,458,066 |
$81,565,388 |
*Sonoma County receives
2.5% of revenues from all jurisdictions except Windsor.
Hence, distributions to the county exceed collections.
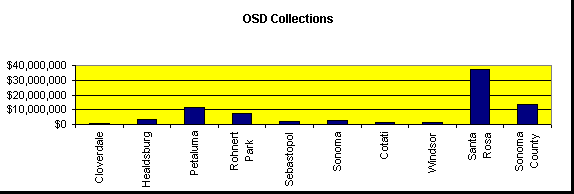
Tax
Jurisdiction |
OSD Collections |
% |
| Cloverdale |
$526,700 |
0.6% |
| Healdsburg |
$3,476,887 |
4.1% |
| Petaluma |
$11,741,712 |
13.9% |
| Rohnert Park |
$7,967,748 |
9.4% |
| Sebastopol |
$2,083,730 |
2.5% |
| Sonoma |
$2,747,849 |
3.3% |
| Cotati |
$1,409,878 |
1.7% |
| Windsor |
$1,644,070 |
1.9% |
| Santa Rosa |
$38,684,449 |
45.8% |
| Sonoma County |
$14,175,043 |
16.8% |
|
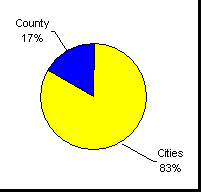
OSD
Collections: Cities vs. County
| Cities |
$70,283,023 |
| County |
$14,175,043 |
|
|