Acquisitions
of the Sonoma County Agricultural The following table summarizes how and where the SCAPOSD has spent its funds. For more detail on each purchase throughout the county, refer to the SCAPOSD Acquisition Detail Table. For detail on purchases within a single Supervisorial District, click on the district name in the table below. |
| _________ | Fee Acres |
Easement Acres |
Expenditures | Current Trails |
Potential Trails |
Current Parkland Acres |
Potential Parkland Acres |
|
| District 1 | 24 | 3,253 | $9,637,000.00 | 0 | 3 | 175 | 1,395 | |
| District 2 | 49 | 5,159 | $10,218,700.00 | 0 | 0 | 0 | 86 | |
| District 3 | 121 | 213 | $2,172,000.00 | 0 | 0 | 0 | 161 | |
| District 4 | 21 | 14,415 | $14,223,000.00 | 0 | 2 | 0 | 240 | |
| District 5 | 173 | 1,123 | $5,156,356.00 | 1 | 3 | 92 | 222 | |
| TOTAL | 388 | 24,551 | $41,407,056.00 | 1 | 8 | 267 | 2,104 |
![]()
| Nearly all the District's expenditures have been for
development rights (easements), rather than outright
purchases (fee interest) of land. The following table and
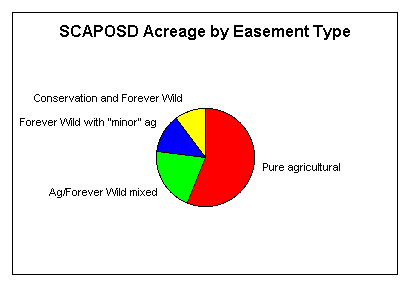
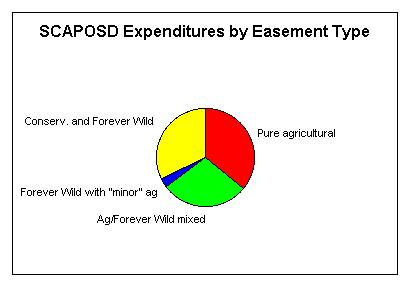
charts show the major types of easements purchased. SCAPOSD Acquistions by easement type through January 1999 |
| Easement type | Acres | %Acres | Payment | %Pmt | |
| Pure agricultural | 13,751.83 | 56% | $14,838,000 | 36% | |
| Ag/Forever Wild mixed | 5,161.41 | 21% | $11,985,000 | 29% | |
| Forever Wild with "minor" ag | 3,122.96 | 13% | $1,350,000 | 3% | |
| Conservation easement | 105.10 | 0% | $990,856 | 2% | |
| Fee (to be) resold with consv. ea. | 473.00 | 2% | $5,852,200 | 14% | |
| Forever Wild | 1,936.70 | 8% | $6,391,000 | 15% | |
| TOTAL | 24,551 | 100% | $41,407,056 | 100% |


![]()
| Nine percent of the acreage acquired or protected are
considered by the District to have recreational
potential. This nine percent has accounted for 28% of the
money spent by the District. Many of these these
"recreational potential" claims, however,
strike CORP as quite a stretch. In any case, only 1% of
the acres and 2% of the expenditures have achieved open
public access today. The following table and charts show
the recreational potential claimed by the District and
the actually realized recreational benefit. SCAPOSD Acquistions by recreational use and potential through January 1999 |
| Public access status | Acres | %Acres | Payment | %Pmt | |
| Open public access in 1999 | 267 | 1.1% | $895,000 | 2% | |
| Recreational "potential" per SCAPOSD | 2,104 | 8.6% | $11,600,000 | 28% | |
| No recreational or access potential | 22,180 | 90.3% | $28,912,056 | 70% | |
| TOTAL | 24,551 | 100% | $41,407,056 | 100% |
![]()